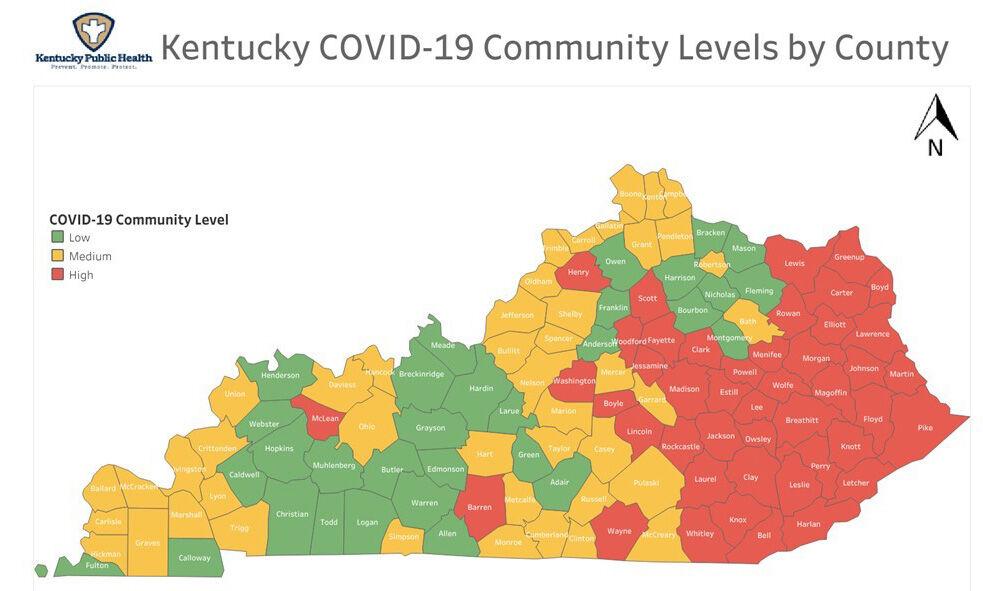
Covid-19 map shows more counties with low community level
Published 12:00 pm Monday, September 19, 2022
|
Getting your Trinity Audio player ready...
|
The latest Covid-19 community level map, issued each Friday based on data from the U.S. Centers for Disease Control and Prevention, showed a substantial increase in counties with a low community level in Kentucky, and a corresponding drop in those with a high community level.
The community levels map breaks down the COVID level by county, with green for low, yellow for medium and red for high levels, which the CDC says is designed to help individuals and communities decide which prevention actions to take based on hospitalizations and cases.
In the Sept. 16 report, 31 Kentucky counties were shown to be in the green category, 45 were yellow, with the remaining 44 in the red. Compare this to two weeks ago, when the September 2 map had 8 green counties, 42 yellow and 70 in the red.
These changes go along with the weekly Covid-19 report issued Monday by the Kentucky Department for Public Health, which showed a 30% decline in new cases over the previous week, along with fewer deaths and a continued drop in the state’s positivity rate for Covid tests.
“Certainly, we’ve now had a couple weeks of decline,” Gov. Andy Beshear said. “It’s still too early to say if we are in a true decline, but it does look promising.
While the World Health Organization has stated the end of the Covid-19 pandemic is in sight, Beshear said he wouldn’t go that far.
“I’d like to see the end, I’d like it to be here, I’d like to move past it,” the governor said. “What the head of the WHO said, and I think he’s right, is let’s make sure we’re playing the game until the very end. Make sure we continue to get vaccinated, make good decisions, to look at the map and ultimately protect ourselves. The end might be in sight, but until we’re actually at the end, this could still take lives.”


